Cellular Proliferation and Tracking

Cellular replication is an ongoing process in all biological systems where tissues are in a state of constant renewal, however, most cells are quiescent and terminally differentiated, existing in a permanent resting phase, where they are not dividing, nor preparing to divide.   When cells become cancerous, somatic mutations in the genome bypass the control mechanisms keeping normally quiescent cells in check, enabling them to proliferate without constraint.

The use of fluorescent probes and flow cytometry to study proliferation can reveal much about the perturbations in biological processes induced by drug treatments in cancer cells and other cellular models.  The subcellular events that can be monitored by this method may include:  gene activation/silencing, protein expression or degradation, DNA replication and cell cycle arrest.  Furthermore, the number of cell divisions that occur in culture can be counted to yield estimations on replication rates.   Like most other flow cytometry experiments, these assays are not limited to homogeneous samples and can be combined with several markers to study distinct populations within heterogeneous mixtures for differential analyses.

Details of some of the more popular flow cytometry based proliferation experiments are given below.

CFDA-SE incorporation for proliferation and cell tracking

As a cell prepares to divide, its membrane enlarges and then is split evenly between its two daughter cells.  CFSE  (5-(and 6)-Carboxyfluorescein diacetate succinimidyl ester) and other similar proliferation dyes (PKH-26, Cell trace violet etc.) take advantage of this biology allowing researchers to count the number of cell divisions that take place during culture.   These dyes passively diffuse across the plasma membrane, become fluorescent upon the cleavage of their diacetyl groups by intracellular esterases and are covalently linked to intracellular proteins allowing their long term retention within the cell.  As cells then divide, the amount of fluorescent label present within each division cohort is diminished by half, compared to the parent, until no/very little CFSE can be detected in the cells.   When plotted on a histogram (see Figure 1), the number of divisions may be counted, however for more detailed analysis this data should be run through modelling software.

Figure 1:  Human peripheral blood mononuclear cells were stained with BioLegend’s CFSE Cell Division Tracking Kit (Cat # 423801), and then stimulated with (filled histogram) or without (open histogram) PHA for 5 days. On day 5, cells were harvested and the CFSE fluorescent staining was analyzed by flow cytometry. ** Re-print of this data was authorized by BioLegend.

Roederer, M. (2011), Interpretation of cellular proliferation data: Avoid the panglossian. Cytometry, 79A: 95–101. doi:10.1002/cyto.a.21010

Two–Dimensional Cell Cycle Analysis for Proliferation:

When cells move through the cell cycle, it is often difficult to accurately assess the proportion of cells in S-phase using just a single parameter.  This especially true since  DNA content analyses are performed with modelling software that rely one of two algorithms (Dean Jett Fox or Watson Pragmatic) to calculate the proportion of cells in each cell cycle stage.  These algorithms are imperfect in that there tends to be some error in determining the true percentage of cells in each phase due to overlap in the G1 – S and S – G2M phase transitions depending on how well the analytes fit the models.

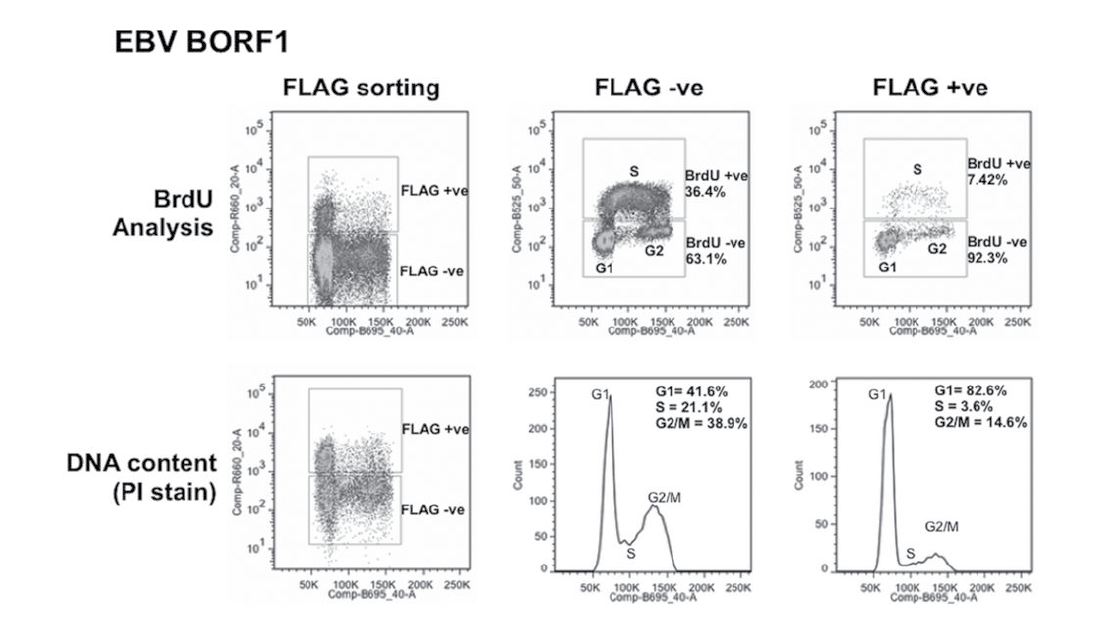
Bromodeoxyuridine, a DNA base analogue like 3H-thymidine, can be incorporated into newly synthesized DNA when added to cell cultures.   When cells are probed with a fluorescent anti-BrdU antibody, a more accurate representation of the cells in each of the cell cycle phases can be obtained and compared over a course of treatments.  Changes in number of the cells in S-phase could indicate accelerated/decelerated cell division when compared to control.    In the figure below, excerpted from J. Virol. 2014;88:4480-4492a clear difference in the percentage of cells found in S phase is observed between the two methods, where the BrdU method yields a greater value in both the FLAG –ve and FLAG +ve sorting conditions.

brdu

Figure 2: Cell cycle effects of EBV proteins in CNE2Z cells. CNE2Z cells were transfected with plasmids expressing FLAG-tagged BORF1 and 24 h later, were either pulse labelled with BrdU (top) or harvested directly and stained with propidium iodide (PI). Cells were divided into FLAG-positive and FLAG-negative cells by FACS and then analyzed for BrdU (S phase) and PI (DNA content) in the top panels or PI alone (bottom). Patrick Paladino et al. J. Virol. 2014;88:4480-4492


A more up to date version of this assay is the EdU Click-iT protocol developed by Molecular Probes.  The harsh denaturing conditions required to expose the BrdU binding sites to antibody make it difficult to combine this assay with other probes. The EdU assay is less harsh and much faster and is a good alternative for BrdU.

Wallace, P. K., Tario, J. D., Fisher, J. L., Wallace, S. S., Ernstoff, M. S. and Muirhead, K. A. (2008), Tracking antigen-driven responses by flow cytometry: Monitoring proliferation by dye dilution. Cytometry, 73A: 1019–1034. doi: 10.1002/cyto.a.20619

Learn More

Intro to Flow

Applications

Work around very talented people.

Lorem ipsum dolor sit amet, consectetur adipiscing elit, sed do eiusmod tempor incididunt ut labore et dolore magna aliqua. 

7226-1 King’s College Circle
Medical Sciences Building University of Toronto
416-976-6524