
MEASURING DNA CONTENT
In normal cells, errors in DNA coding trigger cell cycle arrest in the G1/S or G2M phases and activate cell cycle associated checkpoint pathways that mediate stage dependent DNA repair. Once the damage has been repaired, arrested cells may either remain permanently arrested, re-enter the cell cycle or undergo apoptosis (if the damage is too severe). In cancer, the uncontrolled growth characteristic of the disease is associated with decreased time spent at DNA repair checkpoints, their complete bypass, poor or incomplete DNA repair and accelerated proliferation in the more aggressive forms. The search for improved cancer therapies often focuses on DNA repair checkpoint restoration, which can be studied by monitoring cell cycle progression and timing.
Aside from immunophenotyping, DNA content measurement is one of the most routinely performed flow cytometry-based assays. These experiments require the use of DNA intercalating dyes, such as DAPI, Propidium Iodide, or Dye Cycle Violet, that when nested between DNA bases yield signals directly proportional to the amount of DNA within the nucleus [1]. Since DNA content changes predictably with the stage of the cell cycle, the stoichiometric nature of the dye interactions with nucleic acids makes it possible to determine the cell cycle profile of cultured cells (Figure 1). For example, cells that are rapidly dividing have greater S-phase content in contrast to cells arrested in the G0/G1 or G2/M replication checkpoints [2].
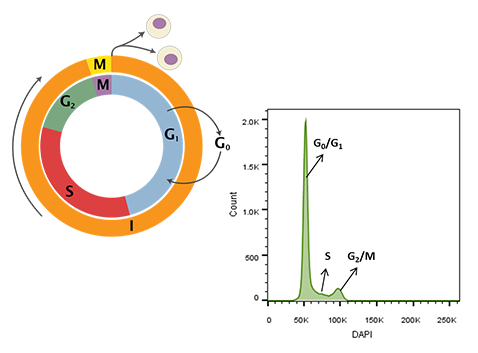
Figure 1. Cell cycle schematic (left) and DAPI-intensity histogram (right) obtained from analysis of DAPI stained single cells. DNA content doubles from G0/G1 to G2/M – the first peak in the histogram at ~50K median fluorescence intensity (MFI) is representative of G0/G1 whereas the second peak at ~ 100K MFI is representative of G2/M. Cells in S-phase have variable DNA content between that of cells in G0/G1 and G2/M during active DNA synthesis. Cell cycle schematic adapted from Richard Wheeler (Zephyris) 2006.
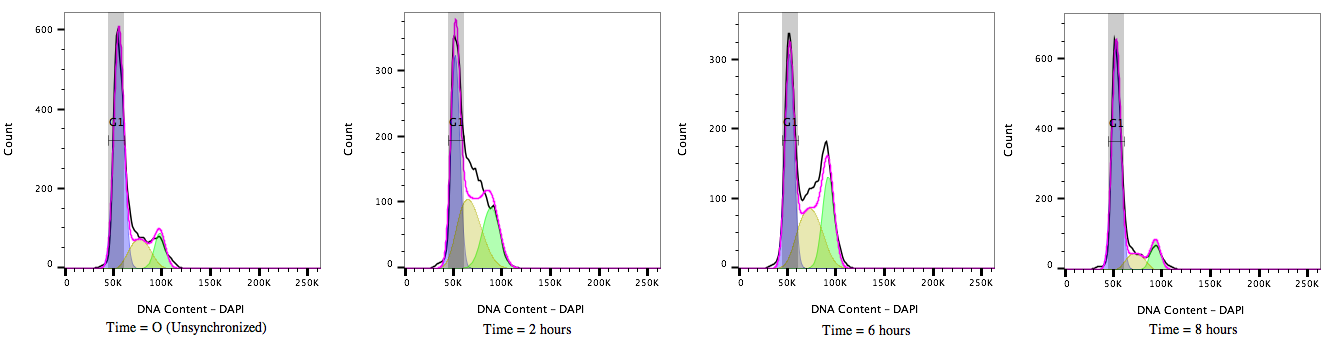
Figure 2: Cell cycle Progression of HEK 293T cells treated with a cell cycle modulating agent cells and stained with DAPI (4’, 6’-Diamidino-2-Phenylindole). Over time, from T = 0 to T= 8 hours, the cultures move through the cell cycle transitioning out of G1/0 (A) through S-phase (B) to G2M accumulation(C) and then cell division before resting again in the G1/0 phase (D).
Cancer cells and cell lines commonly have an irregular number of chromosomes (aneuploidy) caused by replication errors and the uneven distribution of genetic material during mitosis; in tumours, a greater degree of aneuploidy strongly correlates with aggressive hard to treat cancers [3, 4]. Ploidy determinations are important in characterizing tumours in the clinical setting, but are also useful in basic research when studying cancer cell drug responses in vitro.
When measuring ploidy, DNA content is described as a DNA Index (DI) or the ratio of the DNA content of the experimental sample to the DNA content of a corresponding normal control (diploid) population [1]. To properly calculate the DI, an internal DNA standard must be added to each sample to ensure accurate instrument setup and DNA measurements – chicken (CEN) and trout erythrocyte nuclei (TEN) are used for this purpose since their DNA content is known to be less than that of human cells. In fact, CENs have roughly one third the amount of genomic DNA per cell compared to humans [5] making them good internal standards as their DNA profiles will not overlap with those of the tested samples, see Figure 3.
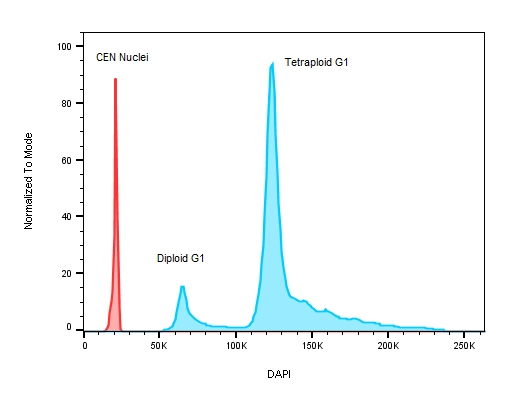
Figure 3: A plot of DNA content on a stem cell line with known replication defects causing the cells to have an abnormal DNA profile. The red peak on the histogram represents the internal control – chicken erythrocyte nuclei with lower roughly 3 x less DNA when compared to human ESC test samples where the ratio between CEN to the diploid G1 peak is 3.044 and 5.767 for the tetraploid G1.
Another useful control in the assessment of ploidy is non-proliferating human lymphocytes. In this scenario a patient’s own lymphocytes may be acquired alongside their tumour cells to measure any differences between the populations [6].
For accurate measurements, it is best to acquire data on isolated nuclei. Mitochondria multiply in response the increased energy demands of larger cells and have their own DNA and replication apparatus. As the mitochondrial burden in the cell increases this extra-nuclear DNA can increase background DNA fluorescence making ploidy measurements difficult [1].
[1] Darzynkiewicz, Z., Halicka, H. D., & Zhao, H. (2010). Analysis of Cellular DNA Content by Flow and Laser Scanning Cytometry. Advances in Experimental Medicine and Biology, 676, 137–147.
[2] Darzynkiewicz, Z., Traganos, F., Zhao, H., Halicka, H. D., & Li, J. (2011). Cytometry of DNA Replication and RNA Synthesis: Historical Perspective and Recent Advances Based on “Click Chemistry.” Cytometry. Part A : The Journal of the International Society for Analytical Cytology, 79(5), 328–337. http://doi.org/10.1002/cyto.a.21048
[3] Yildirim‐Assaf S, Coumbos A, Hopfenmüller W, Foss H, Stein H, Kühn W. The prognostic significance of determining DNA content in breast cancer by DNA image cytometry: the role of high grade aneuploidy in node negative breast cancer. Journal of Clinical Pathology. 2007;60(6):649-655. doi:10.1136/jcp.2005.035550.
[4] Rancés Blanco, Charles E. Rengifo, Mercedes Cedeño, Milagros Frómeta, and Enrique Rengifo, “Flow Cytometric Measurement of Aneuploid DNA Content Correlates with High S-Phase Fraction and Poor Prognosis in Patients with Non-Small-Cell Lung Cancer,” ISRN Biomarkers, vol. 2013, Article ID 354123, 8 pages, 2013. doi:10.1155/2013/354123
[5] Iversen, O. E. and Laerum, O. D. (1987), Trout and salmon erythrocytes and human leukocytes as internal standards for ploidy control in flow cytometry. Cytometry, 8: 190–196. doi:10.1002/cyto.990080212
[6] Benn, D. E. and Robinson, B. G. (1996), Peripheral blood mononuclear cells are a reliable internal standard for the flow cytometric DNA analysis of frozen malignant breast biopsies. Cytometry, 26: 161–165. doi:10.1002/(SICI)1097-0320(19960615)26:2<161::AID-CYTO10>3.0.CO;2-L